Top 6 Tools for Predicting Gold Price Movements
Gold prices are highly influenced by market trends, economic indicators, and sentiment. Predicting these movements can be challenging, but tools like AI platforms, technical analysis software, and sentiment trackers make it easier. Below are six tools that help traders and investors forecast gold price changes effectively:
- Stonksmaster's Substack: Provides daily gold price range predictions using momentum-based algorithms.
- TradingView: Offers advanced charting tools and community-driven insights for technical analysis.
- Incite AI: Combines real-time market data, sentiment analysis, and long-term metrics for comprehensive forecasts.
- Refinitiv Eikon: Delivers real-time market insights, risk alerts, and in-depth analytics tailored for commodities.
- GoldPrice.org: Tracks economic indicators, historical data, and live gold prices in multiple currencies.
- MetaTrader 5: A customizable platform with gold-specific indicators for automated trading and technical analysis.
Quick Comparison
| Tool Name | Key Features | Price Range | Best For |
|---|---|---|---|
| Stonksmaster's Substack | Daily price ranges, multi-asset coverage | Free – Premium plans | Momentum-based range forecasts |
| TradingView | Technical indicators, community insights | $0 – $59.95/month | Advanced charting and patterns |
| Incite AI | AI-driven models, sentiment analysis | Custom pricing | Comprehensive, real-time predictions |
| Refinitiv Eikon | Real-time data, risk analytics | Enterprise pricing | In-depth market analysis |
| GoldPrice.org | Economic indicators, live prices | Free | Historical and live data tracking |
| MetaTrader 5 | Automated trading, gold indicators | Broker-dependent | Algorithmic and technical trading |
Each tool caters to different needs, from short-term traders to long-term investors. Choose based on your trading goals and analysis preferences.
LESSON 3: FORECASTING GOLD PRICE USING @RISK’S ...
How Gold Price Prediction Tools Work
Gold price prediction tools rely on algorithms to evaluate a mix of fundamental and technical factors, helping U.S. traders anticipate price movements.
Market Data Analysis
These tools track supply-and-demand metrics such as annual mining output (around 3,000 tons) and jewelry demand, which accounts for roughly 50–60% of total gold usage.
Economic Indicator Integration
Platforms assess key economic factors known to influence gold prices, including:
- U.S. Dollar Strength: Since gold is priced in dollars, its value often moves inversely to the dollar.
- Real Interest Rates: Negative real rates tend to make gold more appealing as an investment.
- Federal Reserve Policy: Changes in monetary policy impact both real interest rates and the dollar's value.
Technical Analysis Components
These tools evaluate price action (like support and resistance levels), momentum indicators (such as MACD and RSI), and volume patterns to determine trend strength and validate market movements.
Real-World Performance Example
In the first half of 2024, forecasts correctly identified a bull market. Gold prices climbed from $2,160 to $2,472.46 per ounce, driven by geopolitical tensions and shifts in monetary policy.
Sentiment Analysis Integration
Sentiment analysis pulls insights from news outlets, social media, and market positioning. This proved crucial during 2023, when gold experienced price swings of about 15%, fluctuating between $1,800 and $2,075.
These functionalities form the foundation of the six forecasting tools discussed in the next section.
1. Stonksmaster's Substack
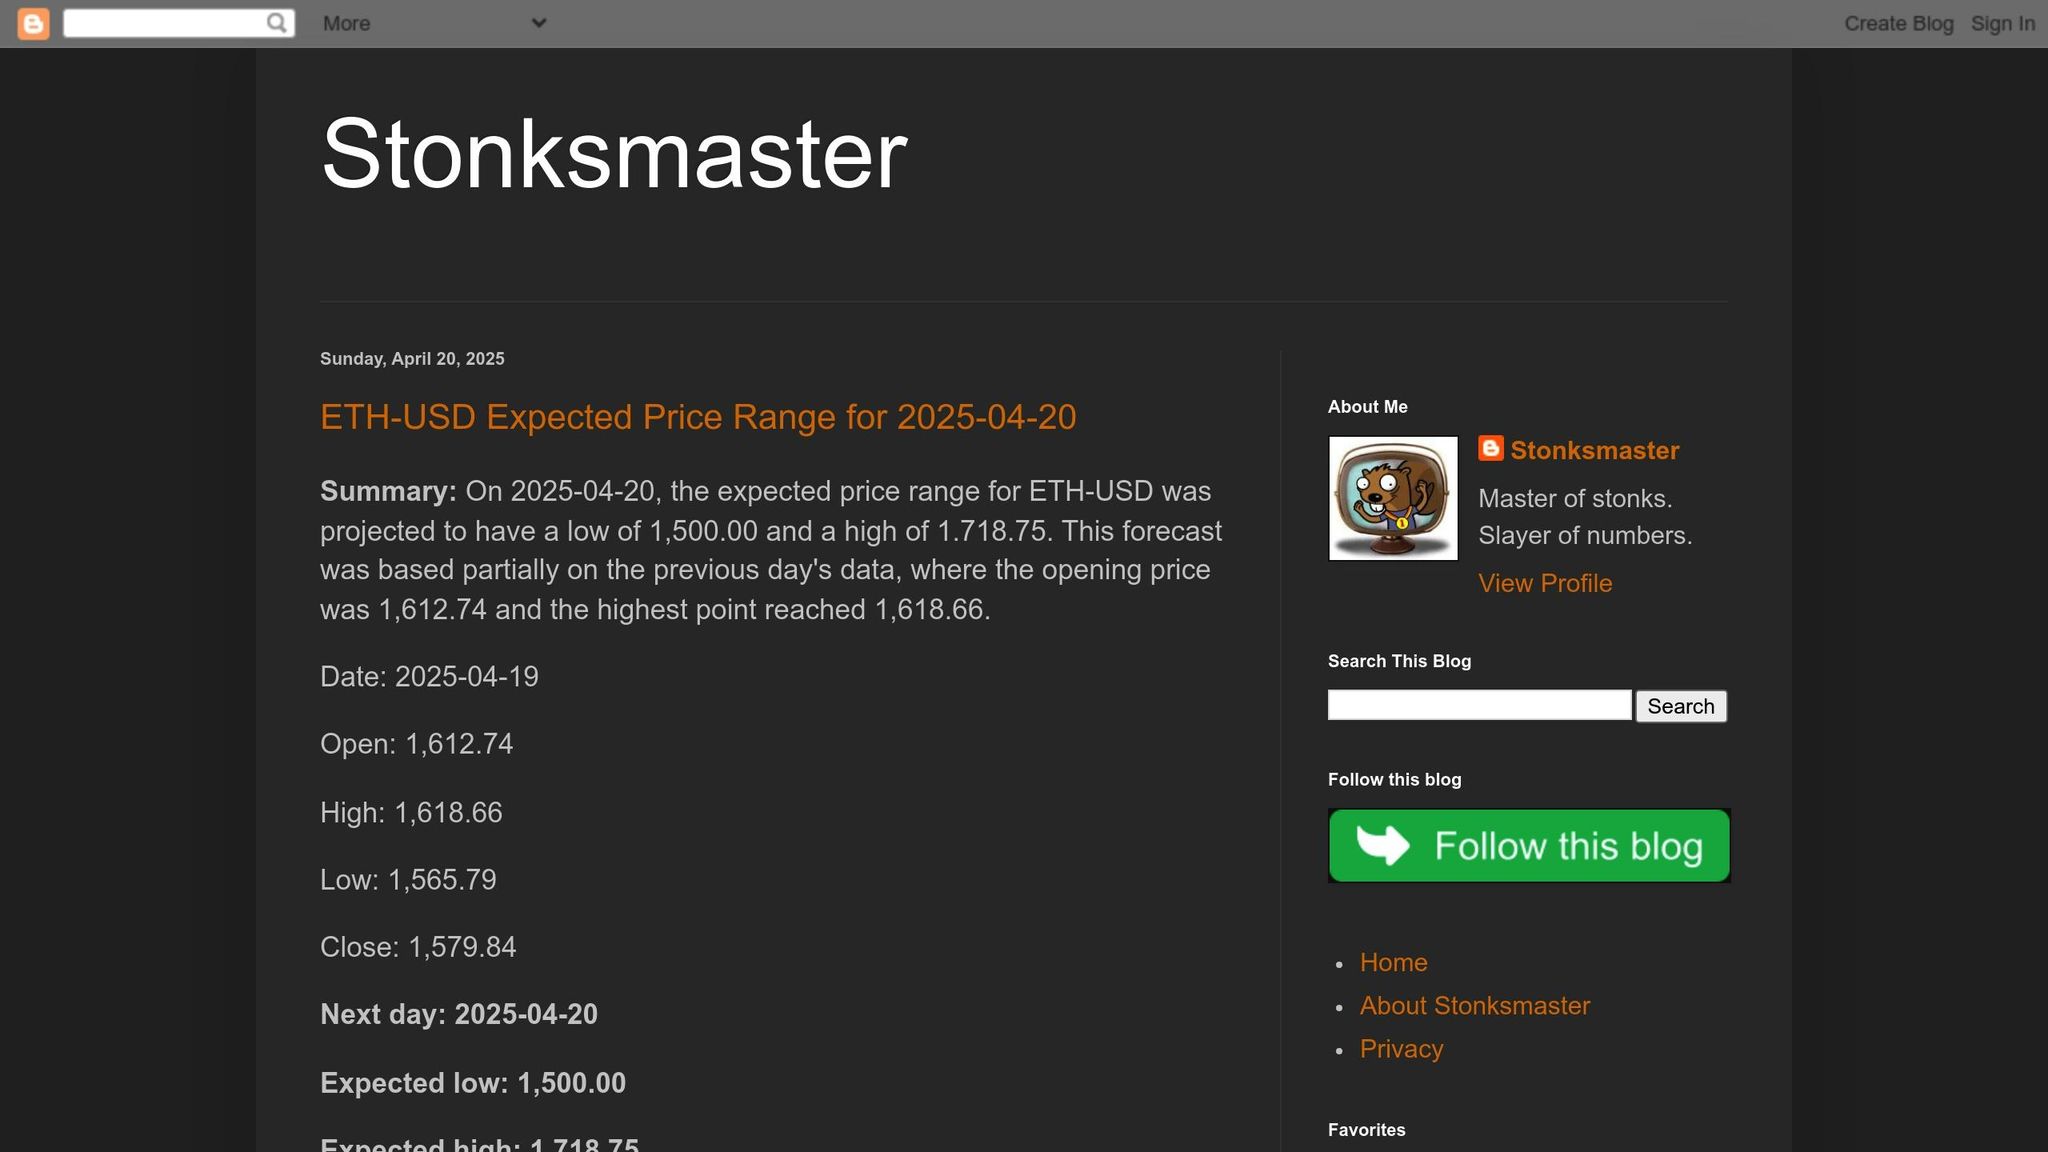
Stonksmaster's Substack uses the previous day's OHLC (Open, High, Low, Close) data and a momentum-based algorithm to calculate daily expected gold price ranges. This algorithm factors in the last ten closing prices to make its predictions.
For example, on November 27, 2023, it forecasted a low of $1,968.75 and a high of $2,031.25 for December gold futures. This was compared to the prior closing price of $2,003.70.
Key highlights:
- Momentum-based range predictions
- Identification of support and resistance levels
Now, let’s take a look at TradingView’s tools for gold analysis, offering technical charting and insights from its active community.
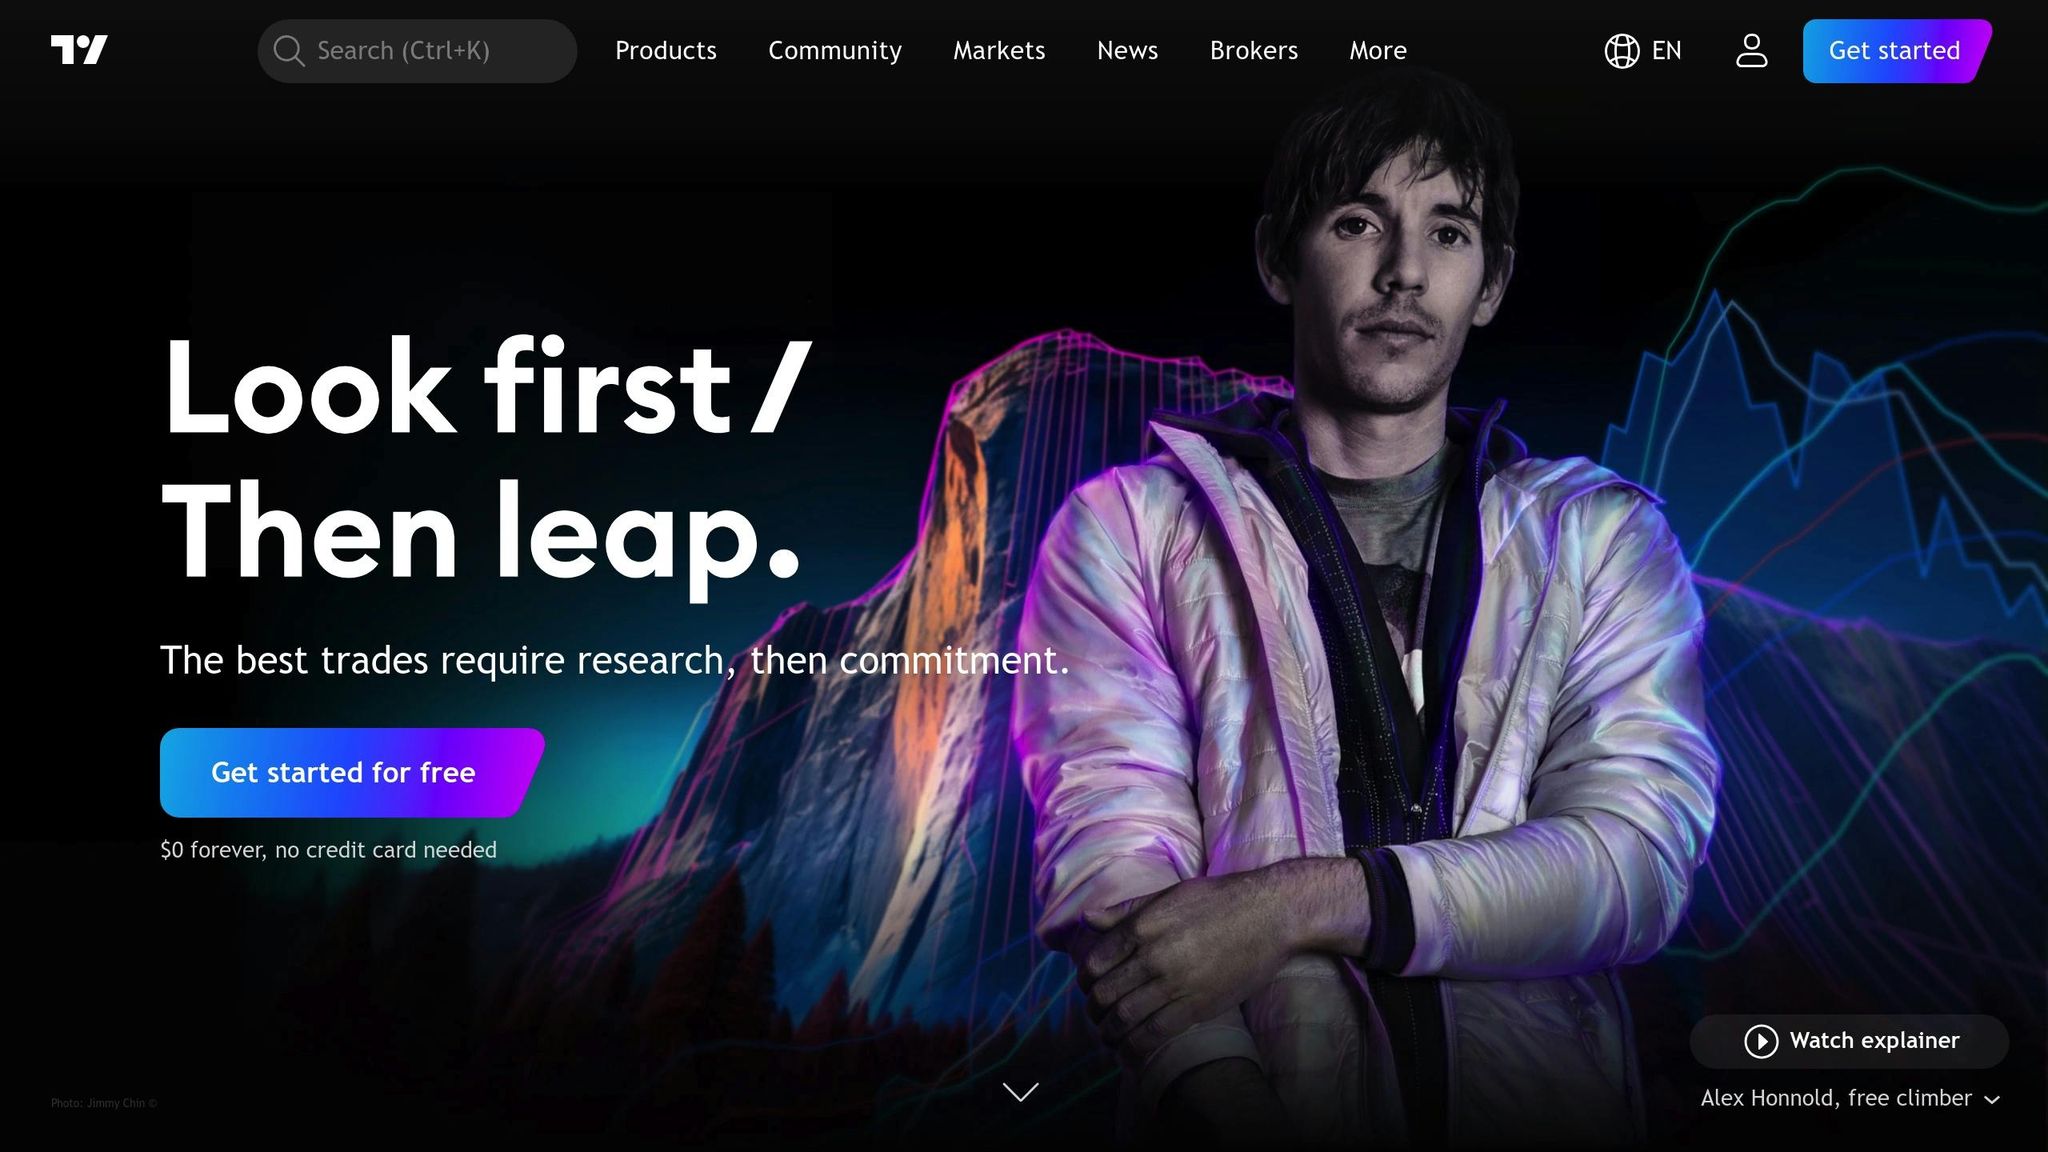
2. TradingView Gold Analysis Tools

After using Stonksmaster's range forecasts, many traders shift to TradingView for its chart-based signals. Unlike Substack's focus on momentum ranges, TradingView highlights visual technical patterns and insights from its community.
TradingView's gold CFD (US$/oz) charts integrate tools like moving averages (EMA, SMA, Hull MA), oscillators (RSI, Stochastic %K, MACD, CCI), and pivot points (Classic, Fibonacci, Woodie). These tools generate clear buy, neutral, or sell signals.
Currently, gold prices are displayed at $3,354.08. The platform's technical analysis summary translates these indicators into actionable classifications: "Sell", "Neutral", or "Buy".
Seasonal trends are also mapped out over the years. By layering EMAs of different lengths (10-200 periods) on XAU/USD charts, users can track both short-term changes and long-term momentum.
For more precision, advanced oscillators like Stochastic RSI, Ultimate Oscillator, and CCI help confirm momentum shifts and identify entry or exit points. Additionally, the "Ideas" section offers community-driven analyses alongside live data.
3. Incite AI Gold Forecast Platform
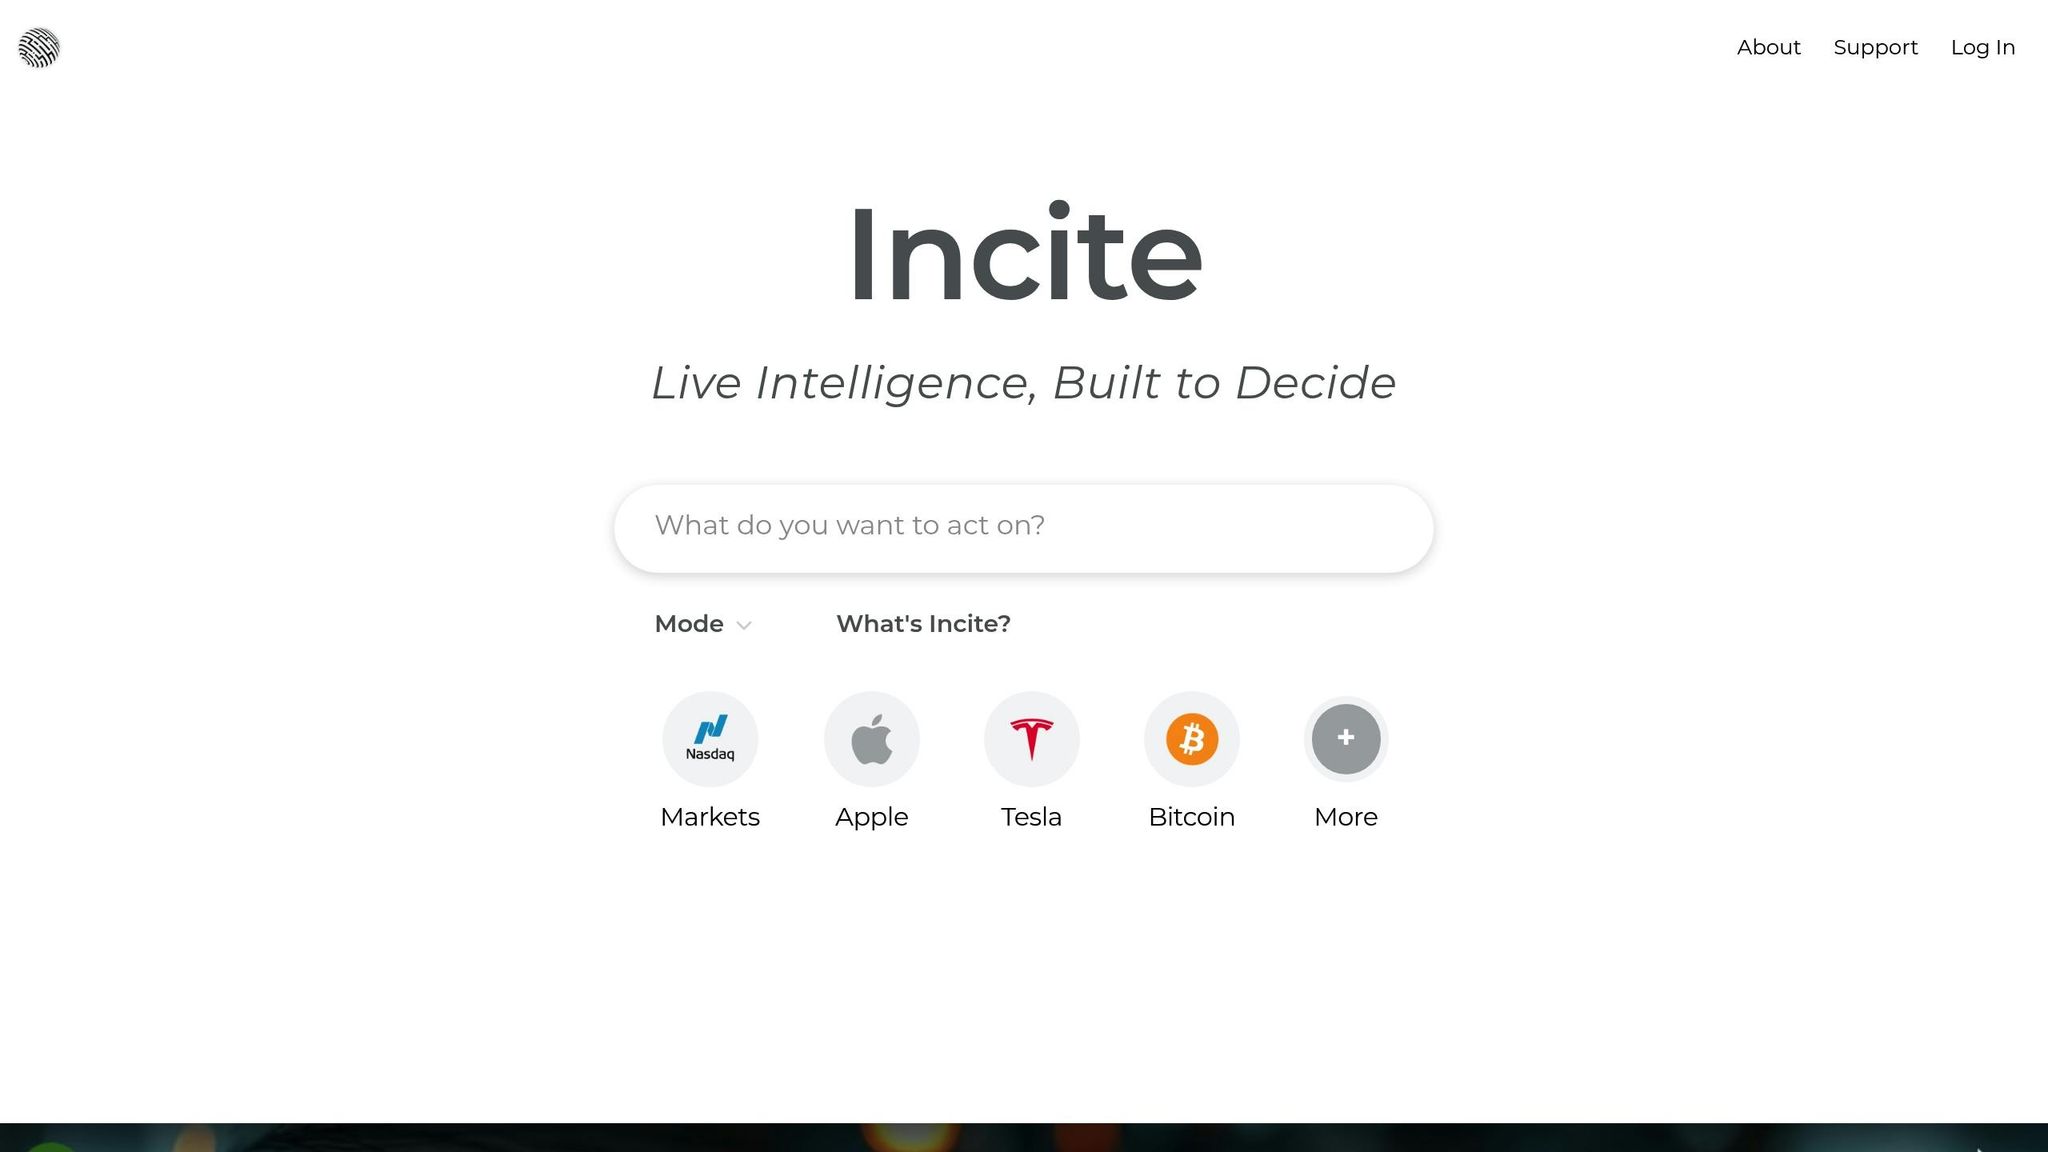
Incite AI takes a different approach to forecasting gold prices by blending real-time market data, fundamental metrics, and sentiment signals. While platforms like TradingView focus on chart signals, Incite AI goes further, incorporating automated risk alerts and long-term value metrics to provide a more comprehensive analysis.
The platform uses intraday data for short-term signals and fundamental metrics for longer-term predictions. For forecasts that span weeks or months, it examines company performance and market trends to determine underlying value.
"Incite AI distinguishes itself by delivering personalized insights and predictive analytics tailored to each user's specific needs. The real-time data processing and integration of multiple data sources ensure that our users receive the most relevant and actionable market insights."
Here’s how Incite AI structures its analysis:
- Technical Analysis: Tracks price movements and common indicators for short-term trading signals.
- Fundamental Analysis: Reviews financial statements and management performance to evaluate long-term potential.
- Market Sentiment: Analyzes news feeds and trading data to capture the current market mood.
The platform also incorporates volatility metrics and risk-management alerts to keep its forecasts up to date.
With its real-time updates and dynamic analytics, Incite AI helps traders react quickly to market changes. This makes it a useful tool for both newcomers and seasoned gold market investors.
sbb-itb-fe836fc
4. Refinitiv Eikon Commodities Dashboard
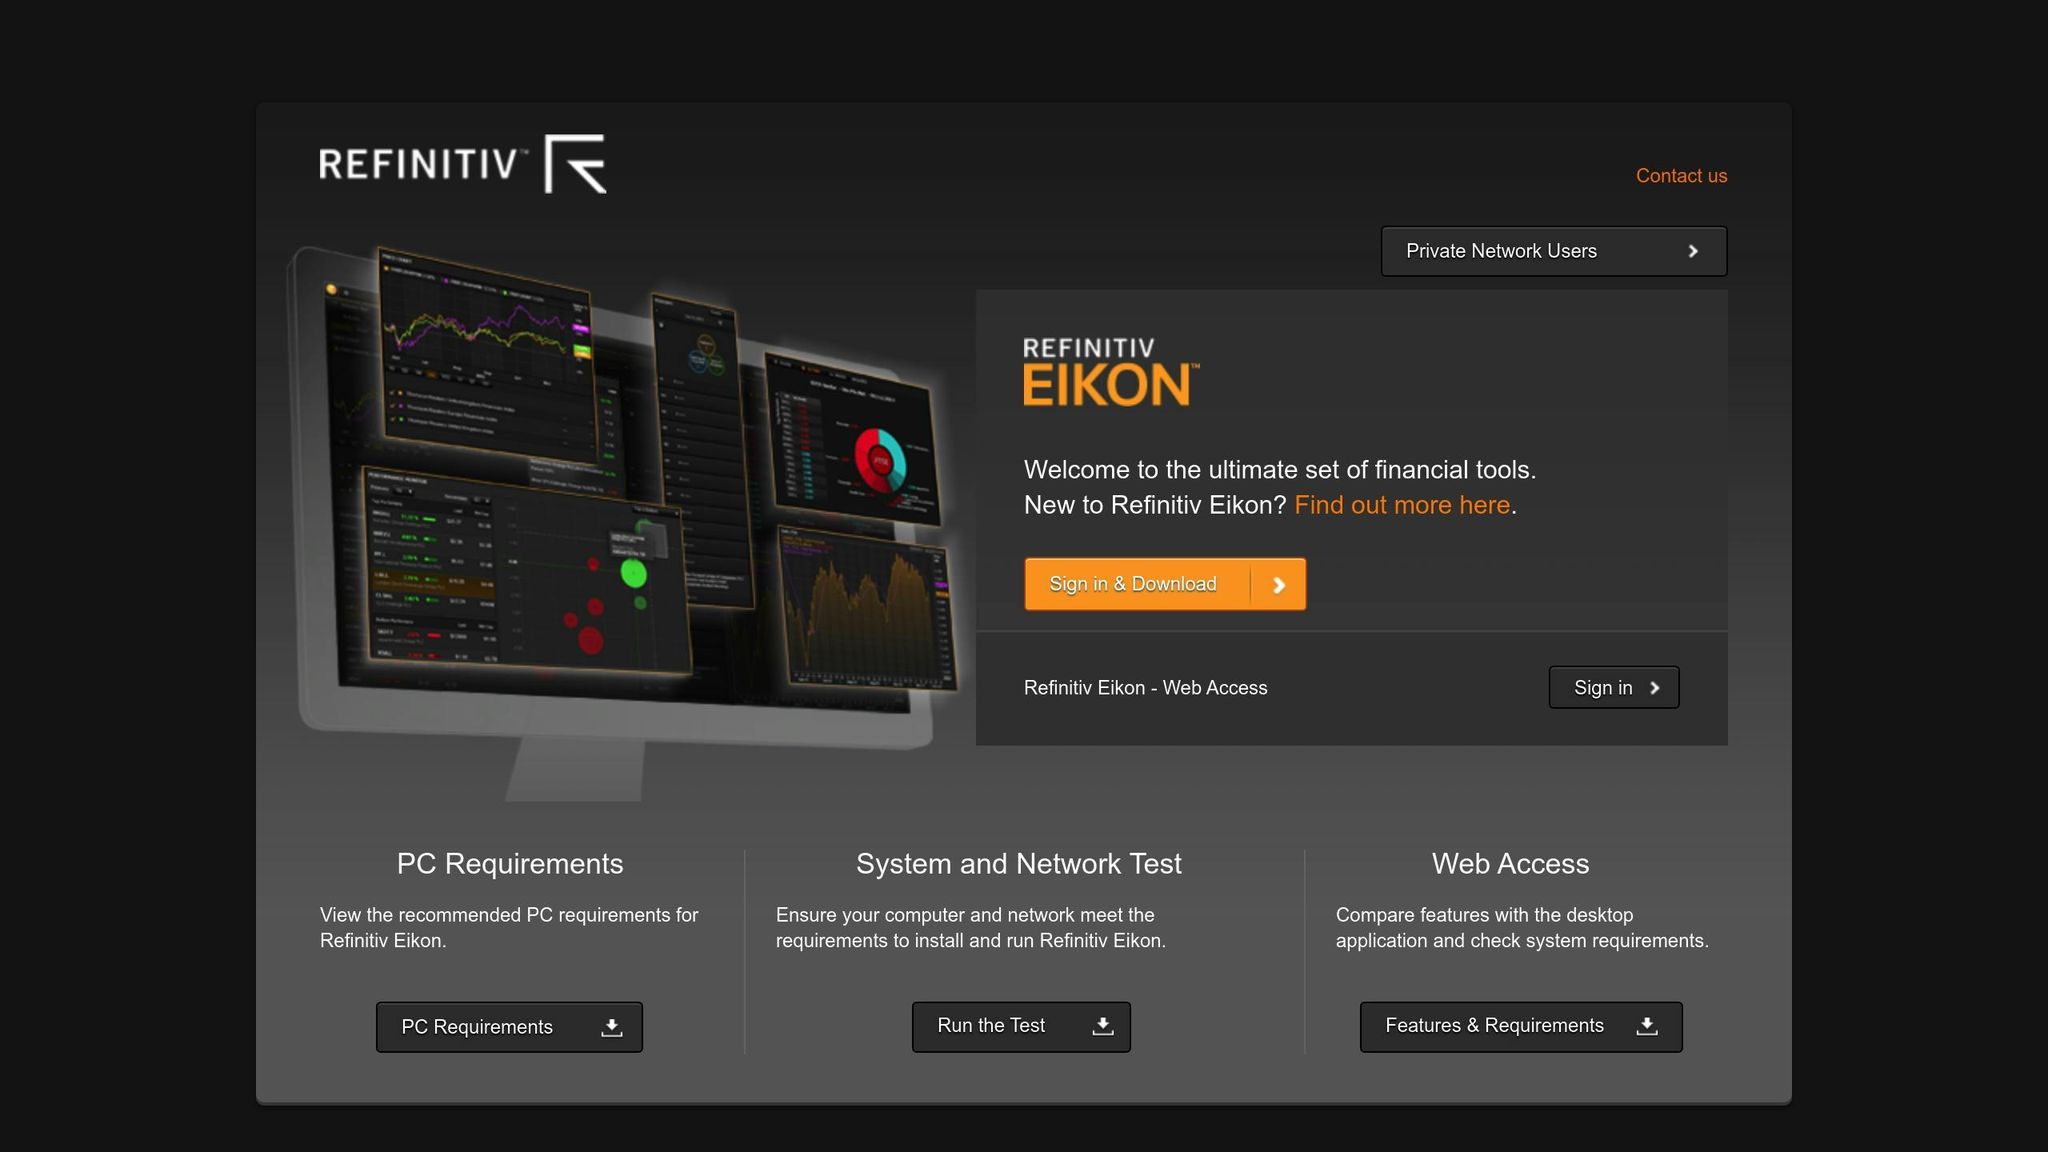
LSEG Workspace (formerly known as Refinitiv Eikon Commodities Dashboard) provides real-time insights, detailed analytics, and interactive tools tailored for gold trading.
Key Features:
- Real-Time Market Insights: A global team of over 200 commodities journalists across 20 countries delivers up-to-the-minute updates on the gold market.
- Interactive Visual Tools: Charts and visualizations help analyze commodity flows, weather patterns, and vessel movements.
- Integrated Research Access: Includes broker research, Reuters News, and over 10,000 trusted sources.
- Risk Alerts: Notifications to identify potential trading risks in the gold market.
This platform uses specialized metals analytics to process complex data, helping traders spot price trends and uncover trading opportunities in a fast-moving market.
Up next: Take a look at GoldPrice.org’s economic indicator tracker.
Refinitiv data on specialist commodities journalists
Refinitiv data on authoritative sources and broker research
5. GoldPrice.org Economic Indicator Tracker
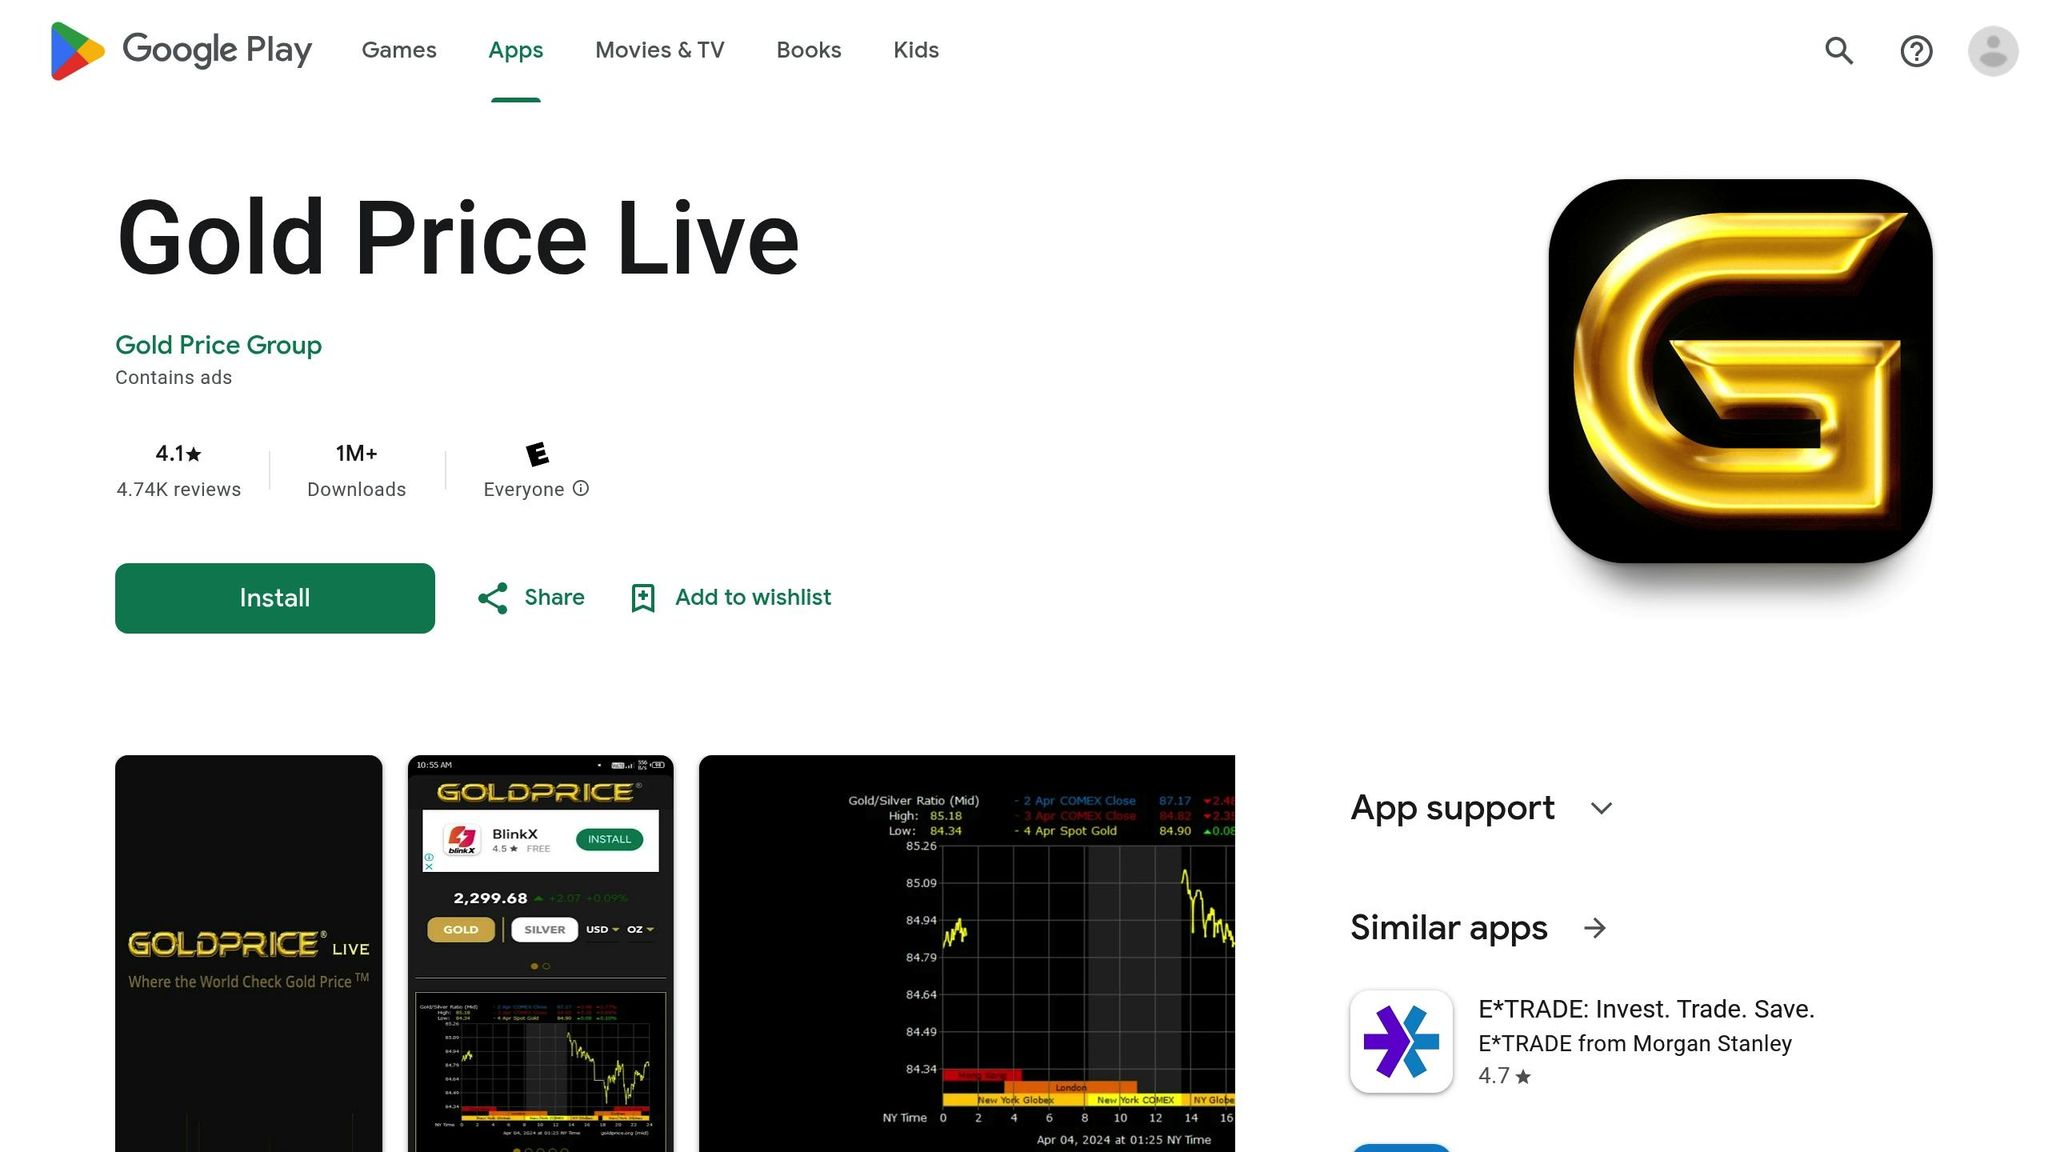
GoldPrice.org's Economic Indicator Tracker provides gold prices in ounces, grams, and kilograms across 160 currencies. It features historical charts ranging from 1 day to 43 years. The platform also offers daily commentary, a dealer locator, calculators for valuing holdings and coins, and mobile apps for iOS and Android with live tickers and news updates.
In 2025, U.S. gold prices increased by 26.3%, significantly surpassing the historical average of 8.3%.
6. MetaTrader 5 with Gold-Specific Indicators
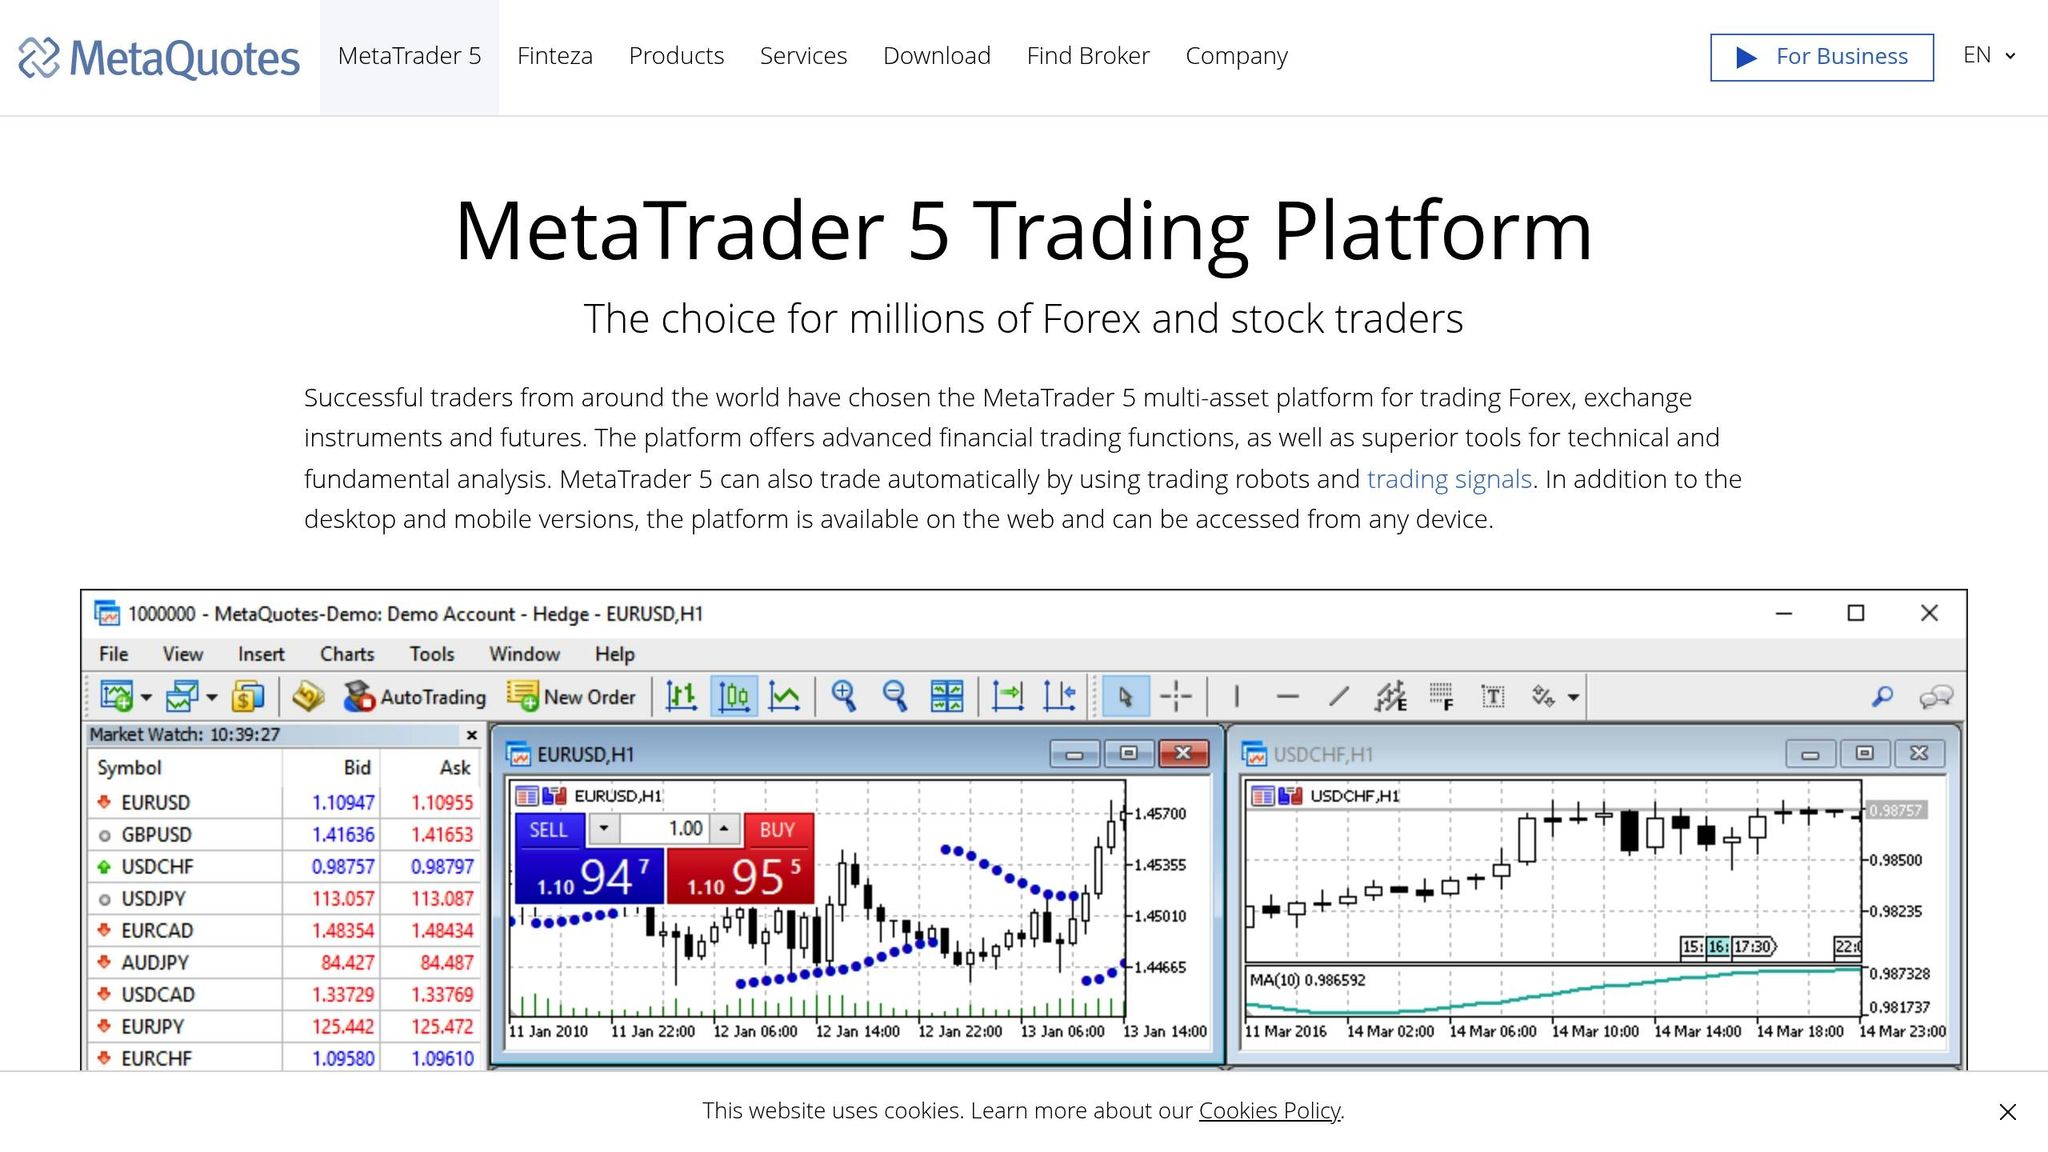
MetaTrader 5 offers a customizable desktop platform equipped with tools specifically designed for gold trading. Gold is commonly traded as XAU/USD, XAU/EUR, XAU/GBP, and XAU/JPY.
Gold-Specific Indicators
- Accelerator Oscillator: When this crosses above zero, it often indicates bullish momentum.
- Bollinger Bands: Traders rely on breakouts from these bands to decide when to enter or exit trades.
With MetaTrader 5, you can manage up to 100 charts, analyze 21 timeframes, use custom Expert Advisors, and leverage over 40 built-in indicators along with 44 analytical tools. These features allow traders to build detailed gold price models and automate their strategies - all within one platform.
"MetaTrader 5 is a superior platform for algorithmic traders" – Moneta Markets
Tool Features and Capabilities
Here's a breakdown of some popular tools for predicting gold prices, including their features, data sources, pricing, and standout functions:
| Tool Name | Key Features | Data Sources | Price Range | Standout Functions |
|---|---|---|---|---|
| Stonksmaster's Substack | • Daily price ranges • Multi-asset coverage • Premium options |
• Market data feeds • Economic indicators |
Free – Premium plans | Daily gold price range forecasts |
| TradingView Gold Analysis | • Technical indicators • Chart patterns • Community insights |
• Multiple exchanges • Historical data |
$0 – $59.95/month | Advanced charting with custom indicators |
| Incite AI Platform | • Machine learning models • Sentiment analysis • Automated alerts |
• News feeds • Social media • Market data |
Custom pricing | AI-driven price predictions |
| Refinitiv Eikon | • Real-time data • Research tools • Risk analytics |
• Global markets • Economic data • News sources |
Enterprise pricing | In-depth market analysis |
| GoldPrice.org Tracker | • Economic indicators • Price alerts • Historical data |
• Central bank data • Market feeds |
Free | Live gold prices and economic indicators |
| MetaTrader 5 | • Up to 100 charts • 21 timeframes • 40+ indicators |
• Broker feeds • Historical data |
Broker-dependent | Automated trading capabilities |
Each tool offers a unique approach to forecasting gold prices, catering to different user needs. From AI-based predictions to detailed charting tools, there’s something for everyone. Up next, we'll focus on U.S. market requirements.
U.S. Market Requirements
U.S. traders face specific market rules that influence how gold prices are executed and forecasted. These rules go beyond platform features and are essential for anyone trading in this market.
Trading Hours & Contract Details
- COMEX Gold Futures Trading Hours: 8:20 AM to 1:30 PM CT
- Standard Contract Size: 100 troy ounces
- Tick Value: $10.00 per contract
- Mini Contract Size: 50 troy ounces
- Electronic Trading: Available nearly 24/7 from Sunday to Friday
Regulatory Guidelines
- Futures markets are regulated by the CFTC (Commodity Futures Trading Commission).
- The CME Group imposes additional self-regulatory requirements.
- Margin deposits typically range between 5-10% of the contract value.
- Tax rates are divided into 60% long-term gains and 40% short-term gains.
- Traders must comply with daily position reporting requirements.
These rules help ensure that tools like MetaTrader 5 and Refinitiv Eikon produce forecasts that meet U.S. trading standards.
Conclusion
Match your gold-forecasting tools to your investment objectives and double-check signals across multiple platforms. Enhance your strategy with Stonksmaster's Substack daily range forecasts for reliable benchmarks. Staying equipped with a variety of current tools helps you navigate market changes effectively.