How to Read Daily Oil Price Charts: Beginner's Guide
Oil price charts help traders and investors track market trends and make informed decisions. Here's a quick breakdown of what you need to know:
- Key Benchmarks: West Texas Intermediate (WTI) and Brent Crude are the main global oil price benchmarks.
- WTI: U.S. benchmark, lighter and sweeter.
- Brent: Global benchmark, covers 2/3 of world trade.
- Chart Basics:
- Support Levels: Price floors where buying pressure can stop declines.
- Resistance Levels: Price ceilings where selling pressure may limit growth.
- Breakouts: When prices break support or resistance, signaling potential trend shifts.
- Technical Indicators:
- RSI: Overbought (>70) or oversold (<30) conditions.
- Moving Averages: Track trends (e.g., 50-day EMA vs. 200-day SMA).
- Volume: Confirms price movements and trend strength.
- Tools to Use:
- TradingView: Free, beginner-friendly charting platform.
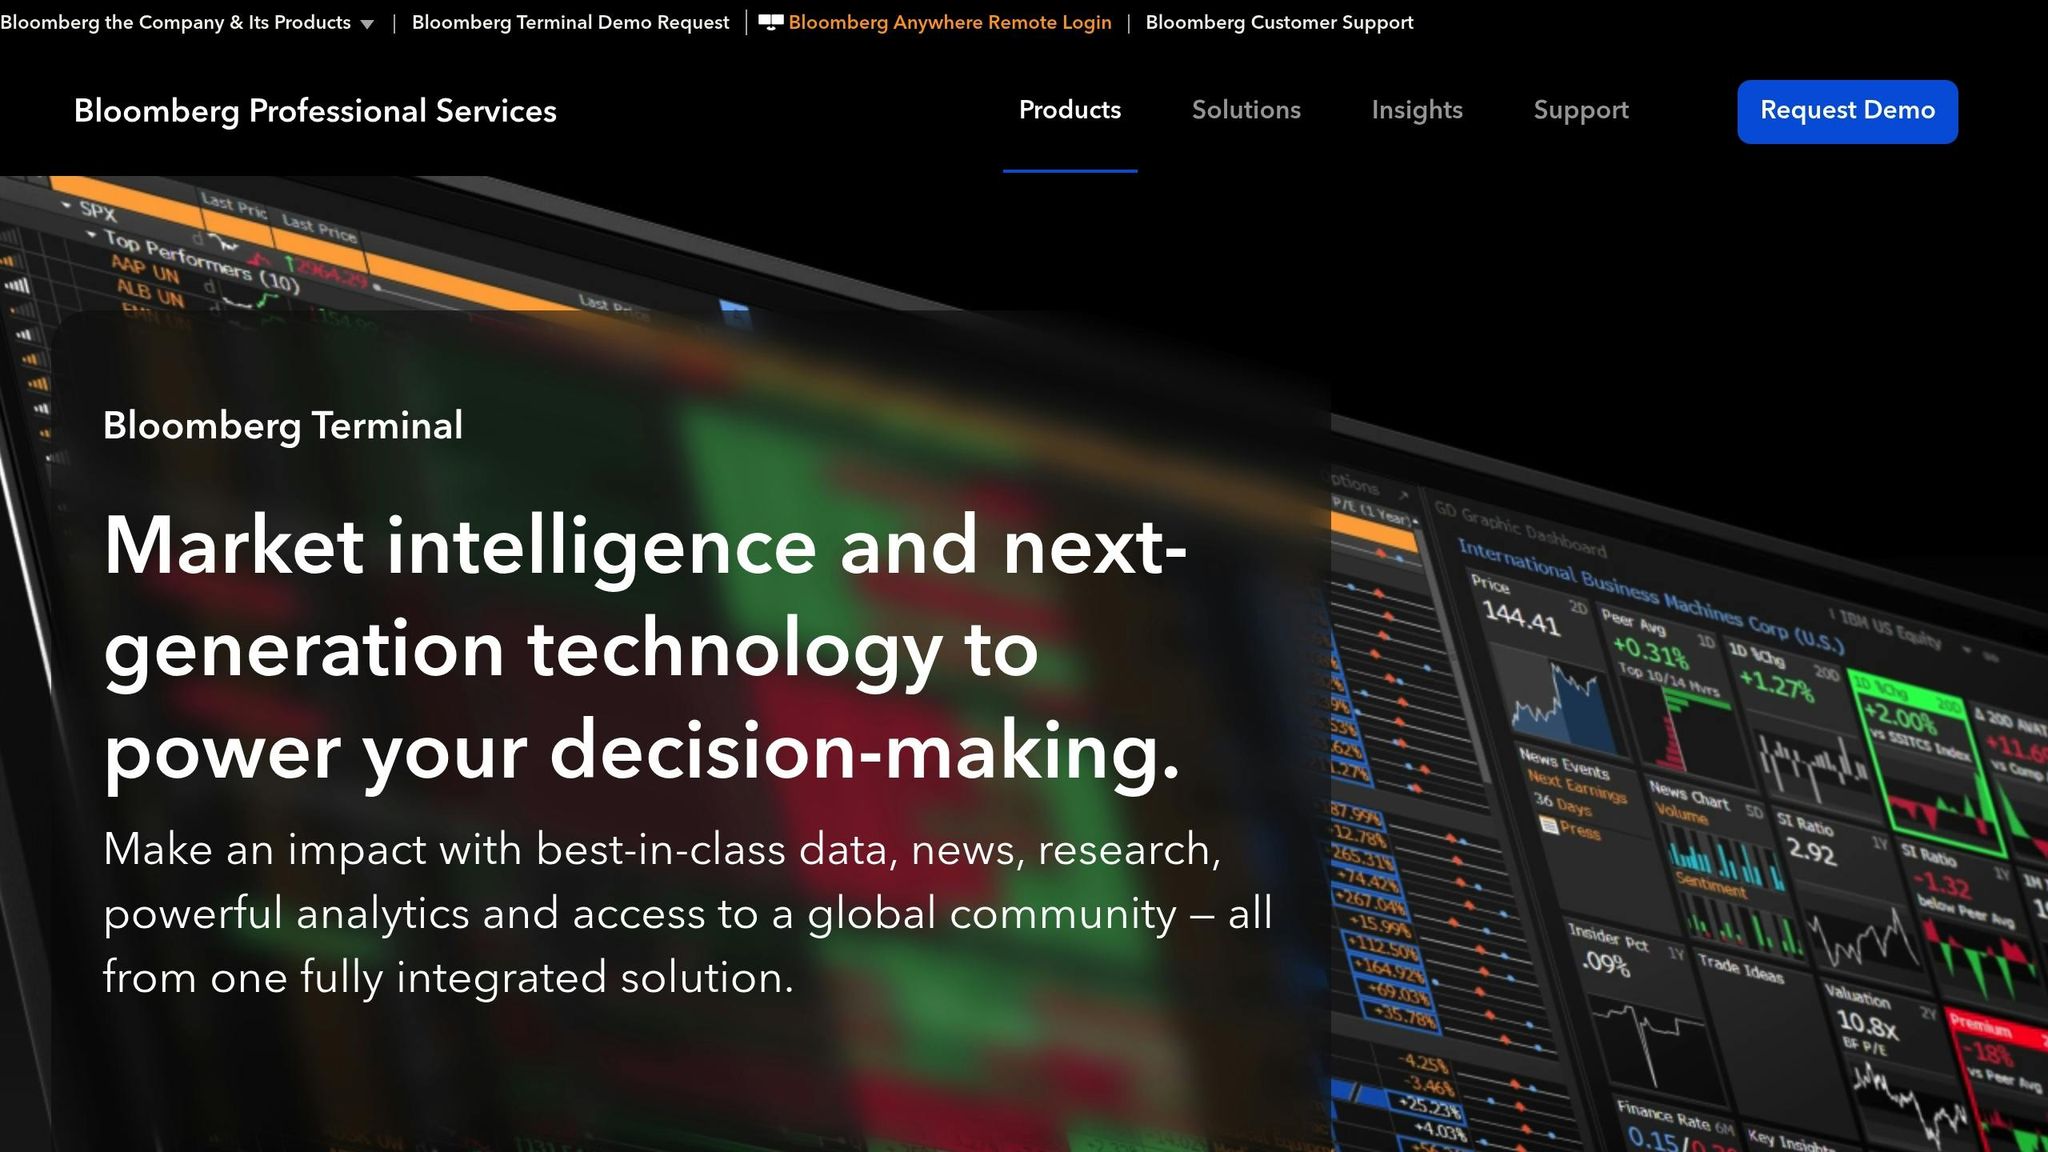
- Bloomberg Terminal: Advanced tool for professionals.
Quick Comparison
| Feature | WTI | Brent |
|---|---|---|
| Location | U.S. (Texas, etc.) | North Sea (Europe) |
| Market Coverage | U.S. Benchmark | Global Benchmark |
| Trading Venue | NYMEX (CME Group) | ICE (London) |
Key Takeaway
To analyze oil charts, identify trends, use technical indicators, and manage risks with tools like stop-loss orders. Platforms like TradingView are great for beginners to practice and refine their skills.
Technical Analysis For Beginners: Candlestick Trading Guide
Chart Components
Understanding key chart elements can help identify market trends and make informed trading decisions.
Price Patterns
Oil price charts often highlight trends through support and resistance levels. These levels are crucial for gauging market behavior:
| Pattern Type | Description | Trading Insight |
|---|---|---|
| Support Level | A price level where buying pressure halts declines | Indicates potential buying opportunities near support. |
| Resistance Level | A price level where selling pressure limits growth | Suggests selling opportunities when price nears resistance. |
| Breakout Zones | Price surpasses support or resistance levels | May hint at upcoming trend shifts. |
Focus on identifying strong zones of support and resistance rather than pinpointing exact prices. A broken support level often flips into a new resistance level and vice versa. This flip can help traders predict possible reversals.
While price patterns provide a visual understanding, technical indicators add numerical analysis to confirm trends.
Technical Indicators
Technical indicators offer additional tools to validate market trends. For instance:
- Relative Strength Index (RSI): Values above 70 suggest overbought conditions, while below 30 indicates oversold conditions.
- Moving Averages:
- Simple Moving Average (SMA): Tracks the average price over a set timeframe.
- Exponential Moving Average (EMA): Places more emphasis on recent prices.
- Volume Analysis: Helps verify price movements by analyzing trading activity.
When combining these tools with price patterns, remember that support and resistance levels are fluid zones, not rigid lines. The more frequently a level is tested, the weaker it becomes, increasing the likelihood of a breakout or breakdown.
For practical trading, consider placing buy orders slightly above support, sell orders below resistance, and always use stop-loss orders to manage risk effectively.
Reading Oil Charts
Understanding oil price charts involves analyzing trends, volume patterns, and technical indicators. Here's a practical guide to applying these methods effectively.
Trend Analysis
Start by drawing trend lines to connect key price points. For an uptrend, link three ascending lows; for a downtrend, connect three descending highs.
Key trend characteristics:
| Trend Type | Characteristics | Trading Implications |
|---|---|---|
| Uptrend | Higher highs, higher lows, positive slope | Look for buying opportunities during pullbacks to the trend line |
| Downtrend | Lower highs, lower lows, negative slope | Consider short positions near trend line resistance |
| Sideways | Price moving within a range | Trade bounces between support and resistance levels |
Moving averages can help confirm trends. For instance, when the 50-day Exponential Moving Average (EMA) crosses above the 200-day Simple Moving Average (SMA), known as a golden cross, it often signals bullish momentum. On the flip side, a death cross suggests bearish momentum.
Once you identify the trend, validate it by analyzing trading volume.
Volume Analysis
Volume patterns provide insights into market strength and potential reversals:
-
Breakout Confirmation
When prices break above resistance with high trading volume, it indicates strong buying pressure and a higher likelihood of trend continuation. -
Reversal Warning
A sudden spike in volume after a prolonged trend, paired with stalled price movement, can signal market exhaustion and a possible reversal.
Chart Analysis Example
By combining trend and volume analysis, you can form a clearer market picture:
-
Initial Assessment
Determine the primary trend using trend lines and moving averages. For example, if crude oil prices trade above both the 50-day and 200-day moving averages with increasing volume, it suggests a strong uptrend. -
Pattern Recognition
Identify common chart patterns that hint at price movements. A double-bottom pattern, for instance, with higher volume on the second bottom, indicates stronger buying pressure and a higher chance of a reversal. -
Volume Confirmation
Validate price movements using volume data. For example, if crude oil breaks above resistance with daily trading volume reaching 10 million contracts, this suggests robust market participation and a likely continuation of the trend.
It's also helpful to analyze multiple timeframes. Short-term traders often rely on 1-5 minute charts, while swing traders focus on 4-hour or daily charts to spot trends.
sbb-itb-fe836fc
Chart Analysis Tools
These platforms help you translate chart insights into actionable strategies. Whether you're analyzing trends or volumes, these tools can support your decision-making.
TradingView

TradingView provides powerful charting tools for USOIL and Light Crude Oil Futures. Its key features include:
- Interactive charts with customizable technical indicators
- A community hub for sharing and exploring trading ideas
- Seasonal charts to spot recurring market patterns
- Tools for volume analysis and setting price alerts
Bloomberg Terminal

For in-depth analysis, Bloomberg Terminal is a go-to solution for professionals. It offers real-time market data and advanced tools, including:
- Live pricing for crude oil and natural gas
- Insights into refined product pricing
- Data on emissions trading
- Access to detailed contract information
- Advanced charting with multiple integrated data feeds
Stonksmaster's Substack
Stonksmaster's Substack delivers daily oil price forecasts and insights on other commodities. It caters to both free users and premium subscribers, offering concise updates for traders looking to stay informed.
For beginners, TradingView's free version provides essential tools. On the other hand, Bloomberg Terminal offers a professional-grade suite for advanced analysis. Select the platform that aligns with your trading style and goals.
Risk Management Tips
Understanding oil price charts is just the beginning - effective risk management is essential for protecting your trading capital. Let’s dive into practical strategies to safeguard your investments and build disciplined trading habits.
Stop-Loss Orders
Stop-loss orders are a key tool for enforcing discipline by automatically executing trades at predetermined prices. Here are three types of stop-loss strategies you can use:
| Strategy Type | Description | Ideal For |
|---|---|---|
| Fixed Price | Sets a specific price level | New traders seeking simplicity |
| Percentage-Based | Activates at a fixed percentage change | Intermediate-level traders |
| Trailing Stop | Adjusts with price movements | Advanced risk management |
To use stop-loss orders effectively:
- Decide the maximum loss you’re willing to accept per trade and set triggers based on technical support levels.
- Regularly monitor and adjust your stop-loss levels as market conditions shift.
Using stop-loss orders is just one piece of the puzzle. Managing how often you trade is equally important.
Trading Frequency
Rather than making multiple trades each day, focus on high-quality opportunities that align with your analysis of oil price charts. Here’s how you can refine your trading approach:
- Stick to specific trading hours that match major market sessions.
- Document the reasoning behind each trade to learn from your decisions.
- Wait for clear, reliable technical signals before entering a trade.
- Review your trading history regularly to prevent overtrading.
Maintaining discipline in your trading habits is crucial, but ongoing skill development is just as important for long-term success.
Skill Development
Improving your ability to analyze charts and make informed decisions takes practice and continuous learning. Concentrate on these areas:
- Technical Analysis: Spend time studying historical oil price trends and technical indicators. Platforms like TradingView can help you practice spotting patterns.
- Risk Assessment: Analyze multiple timeframes to identify key support and resistance levels, which can guide your stop-loss placements.
- Market Insights: Stay up-to-date on factors that influence oil prices, such as global supply and demand, geopolitical events, seasonal trends, and economic reports.
Summary
Main Points
To master oil chart analysis, focus on understanding the factors that influence prices, applying technical tools, and managing risks effectively. For instance, WTI crude oil traded at $73.76 per barrel in January 2025. Here's a breakdown of the essential components for successful analysis:
| Component | Key Considerations | Impact on Analysis |
|---|---|---|
| Price Drivers | Examine global events and U.S. inventory data | Helps predict trend directions |
| Technical Tools | Use moving averages and volume indicators | Identifies entry and exit points |
| Risk Factors | Account for market volatility and currency changes | Affects position sizing decisions |
These elements are crucial for refining both technical strategies and risk management approaches.
Getting Started
Ready to dive into oil chart analysis? Here’s how you can get started:
- Use TradingView's demo account to practice spotting patterns without financial risk.
- Keep an eye on weekly reports from the Energy Information Administration (EIA) and the American Petroleum Institute (API).
- Experiment with the "oil volume candlestick" method, which has shown promising results.
Additionally, focus on practicing with demo accounts to sharpen your pattern recognition skills. Regularly track your performance, review outcomes, and stay updated on key economic reports and OPEC announcements. These steps will help you build confidence and improve your analysis over time.


No comments:
Post a Comment